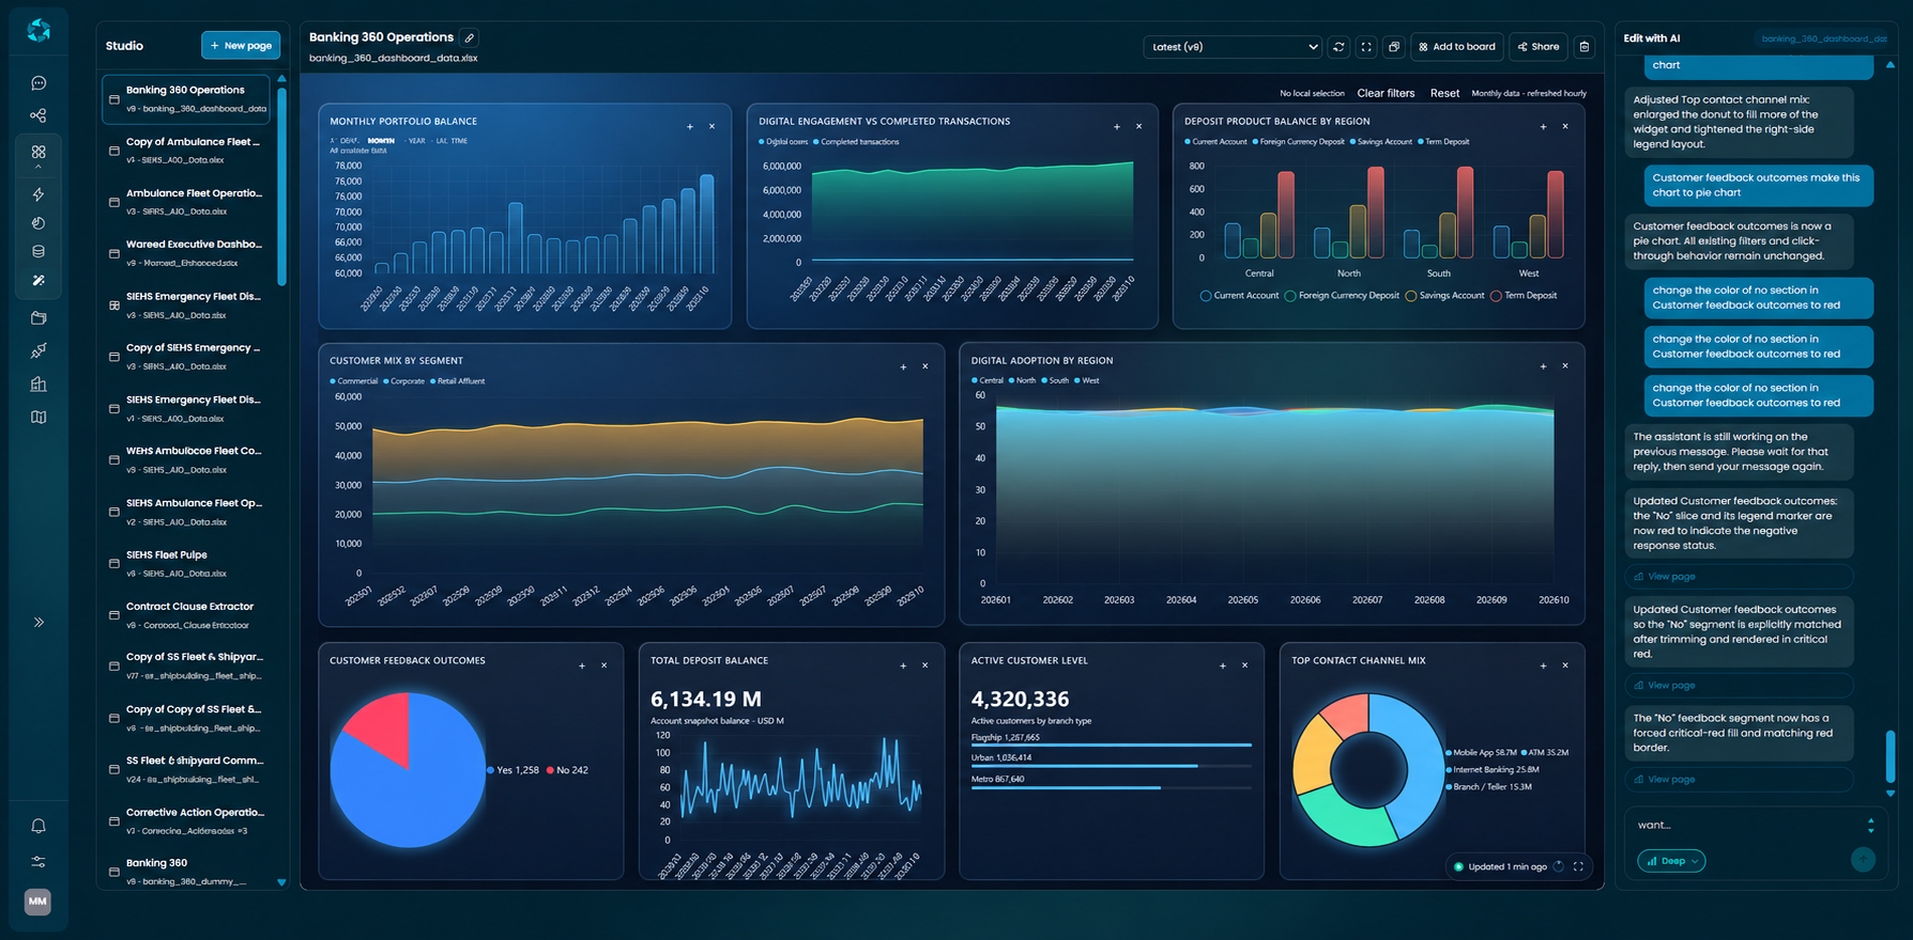
Dashboards AI & BI
Analyze, Visualize,
Monitor,
Act
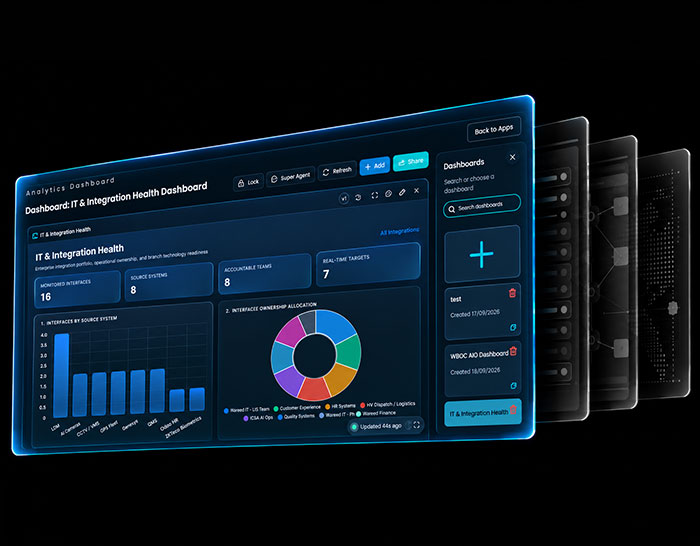
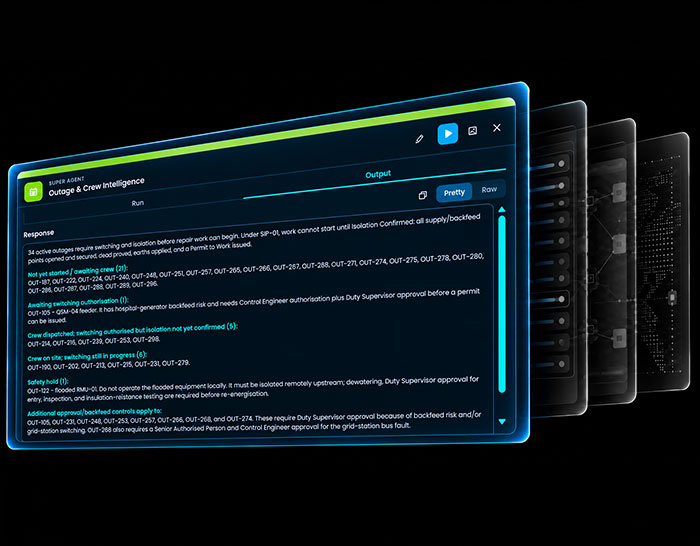
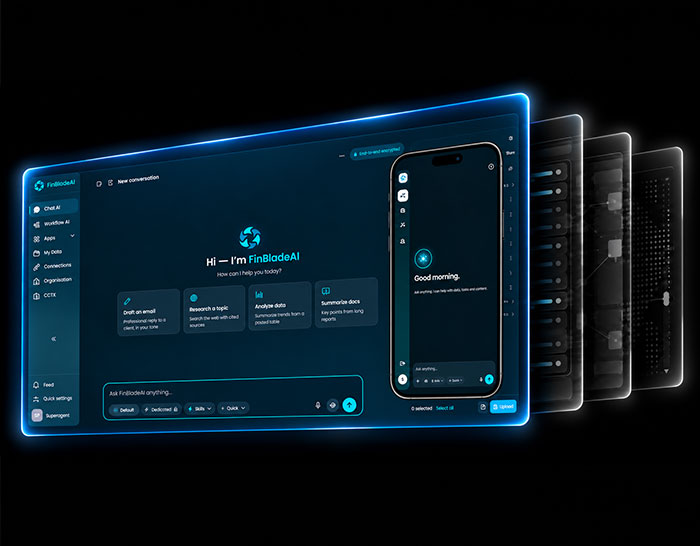
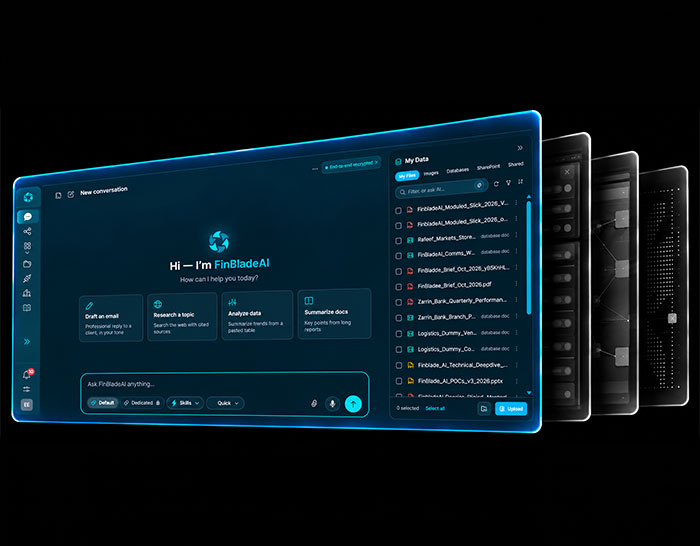
Transform live enterprise data into interactive intelligence with AI-powered analysis, dynamic dashboards, real-time monitoring, and actionable insights.
Business Intelligence.
Reimagined with AI.
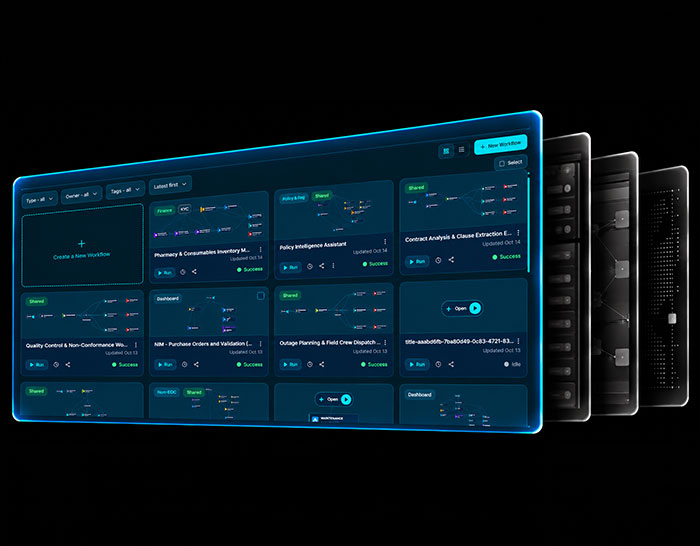
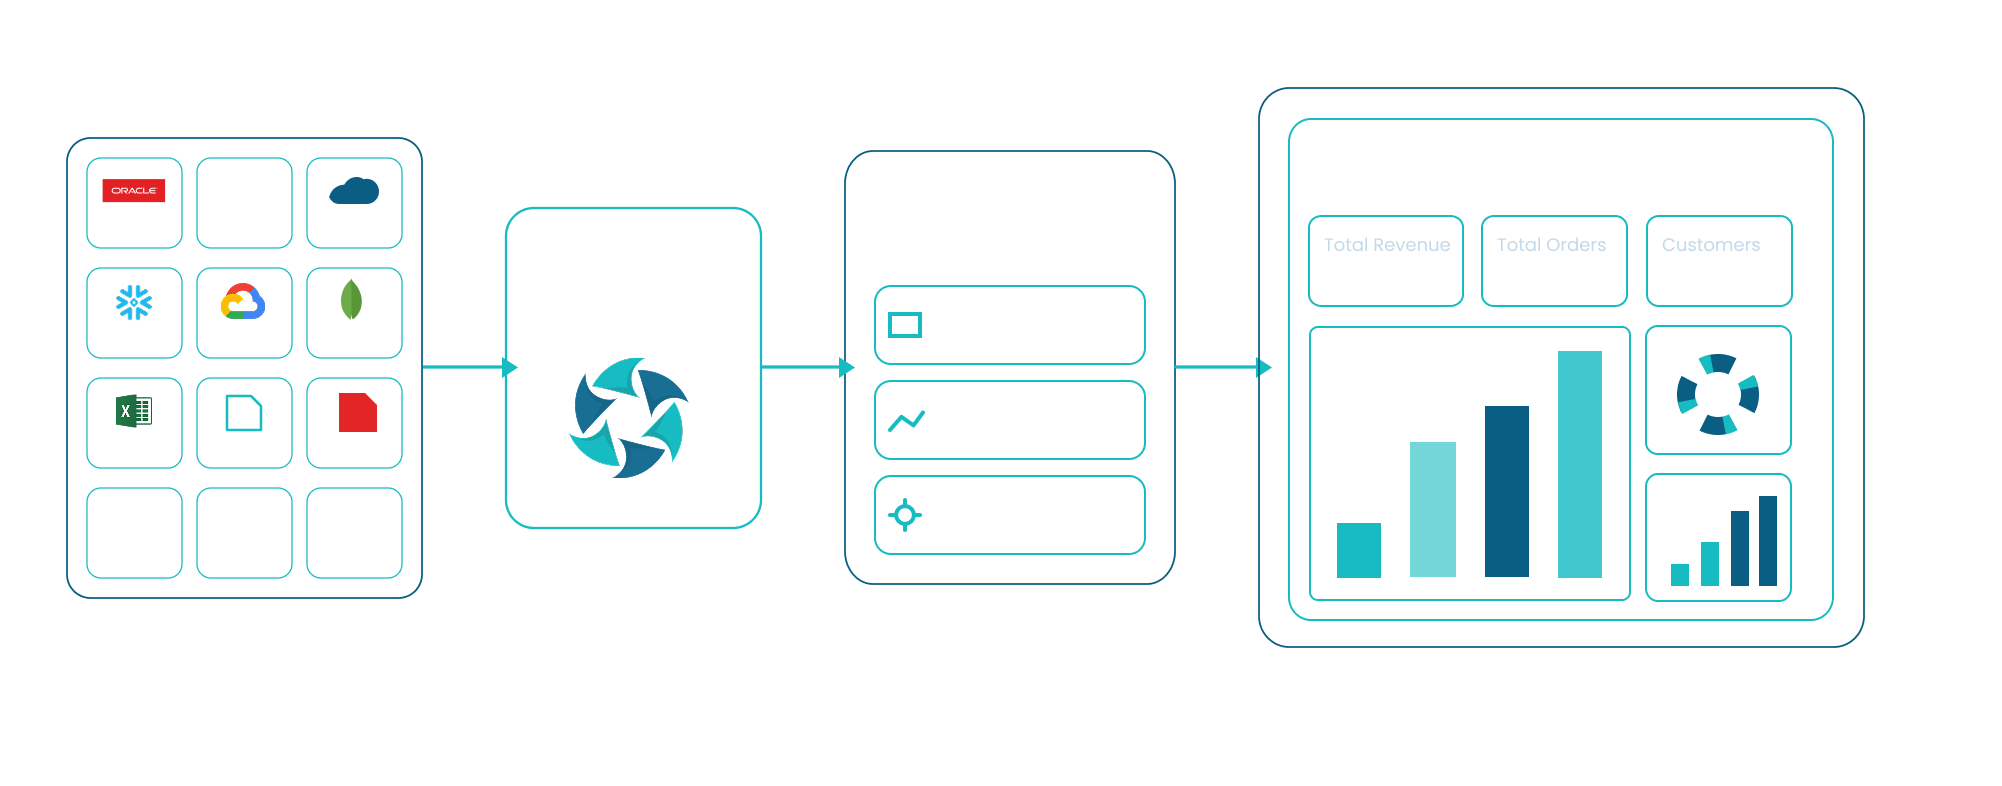
More than traditional BI, FinBlade connects live enterprise data with AI-powered analytics, interactive dashboards, and automation, enabling users to explore, understand, predict, and act on data in real time.
~90%
Faster BI delivery by using AI and no-code tools to create, configure, and adapt dashboards and analytics.
360°
See your data from every angle with live visualization, conversational analysis, and contextual enterprise intelligence.
100%
Use deterministic business rules, statistical methods, analytical models, or AI, with full control over the logic
What Makes FinBlade
Dashboard AI & BI Different?
Key Features, Capabilities and Use Cases
View, Explore, Ask & Execute
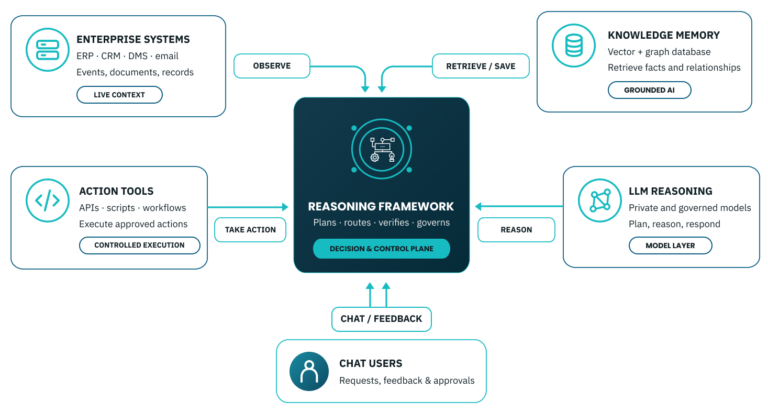
Go beyond static BI by combining interactive visualization with conversational AI and contextual enterprise intelligence.
- Explore live data through filters, drill-downs, segmentation, and interactive visualizations.
- Ask questions about any metric, chart, trend, or data point in natural language.
- Generate AI-driven explanations, summaries, charts, and recommendations.
- Analyze contextual information beyond what is currently displayed by querying connected and authorized enterprise data.
- Bring enterprise knowledge and business context into analysis to understand not only what happened, but why.
AI Analytics You Can Control
Combine deterministic analytics and AI so organizations can choose exactly how every metric, calculation, and insight is produced.
- Define KPIs and calculations using governed business rules and formulas.
- Apply statistical methods, analytical models, forecasting, and predictive analytics.
- Use AI where contextual reasoning, discovery, or interpretation adds value.
- Combine rules, statistical analytics, and AI within the same dashboard experience.
- Maintain transparency and control over the logic behind business-critical insights.
A Leading Choice for On-Premises AI & BI
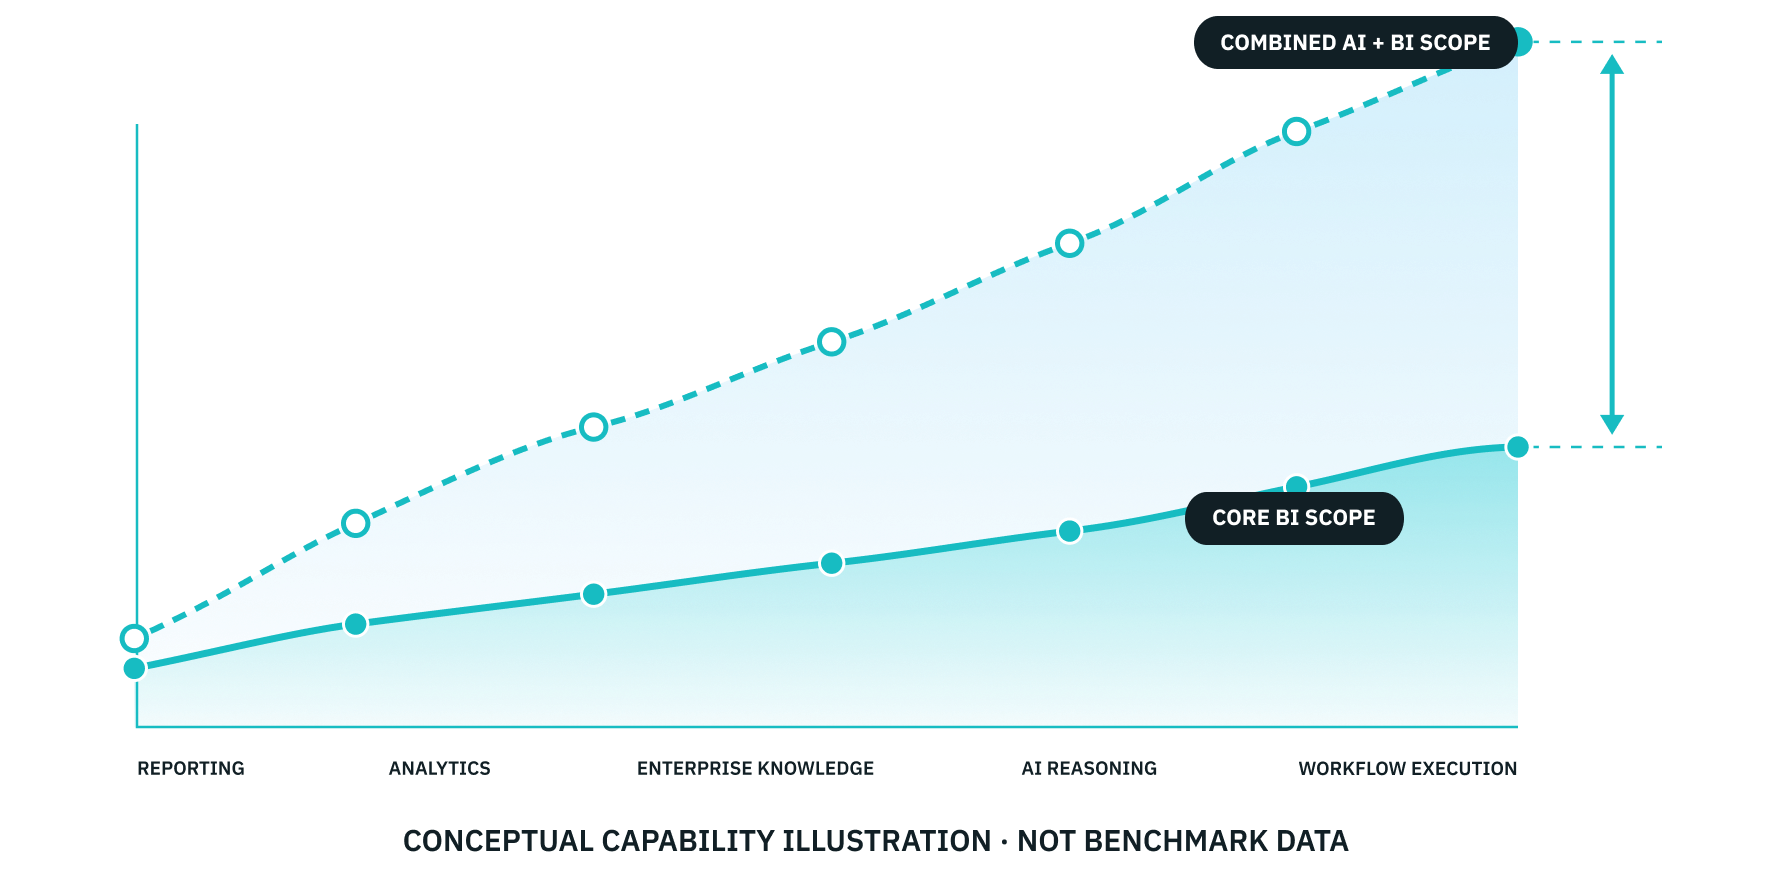
Bring modern AI-powered business intelligence into your own environment, combining advanced dashboards, conversational analytics, enterprise knowledge, predictive intelligence, and workflow execution without depending on public-cloud AI.
- Complete On-Premises BI: Dashboards, analytics, reporting, forecasting, alerts, and AI within one enterprise platform.
- Beyond Traditional BI: Combine rules-based and statistical analytics with AI reasoning, enterprise knowledge, and agentic capabilities.
- Connected to Your Enterprise: Analyze live databases, applications, documents, APIs, and operational systems within the same environment.
- Built for Sovereignty: Deploy on-premises, private cloud, or air-gapped with enterprise governance, permissions, and data control.
What Is Contextual Analytics & Why Does It Matter?
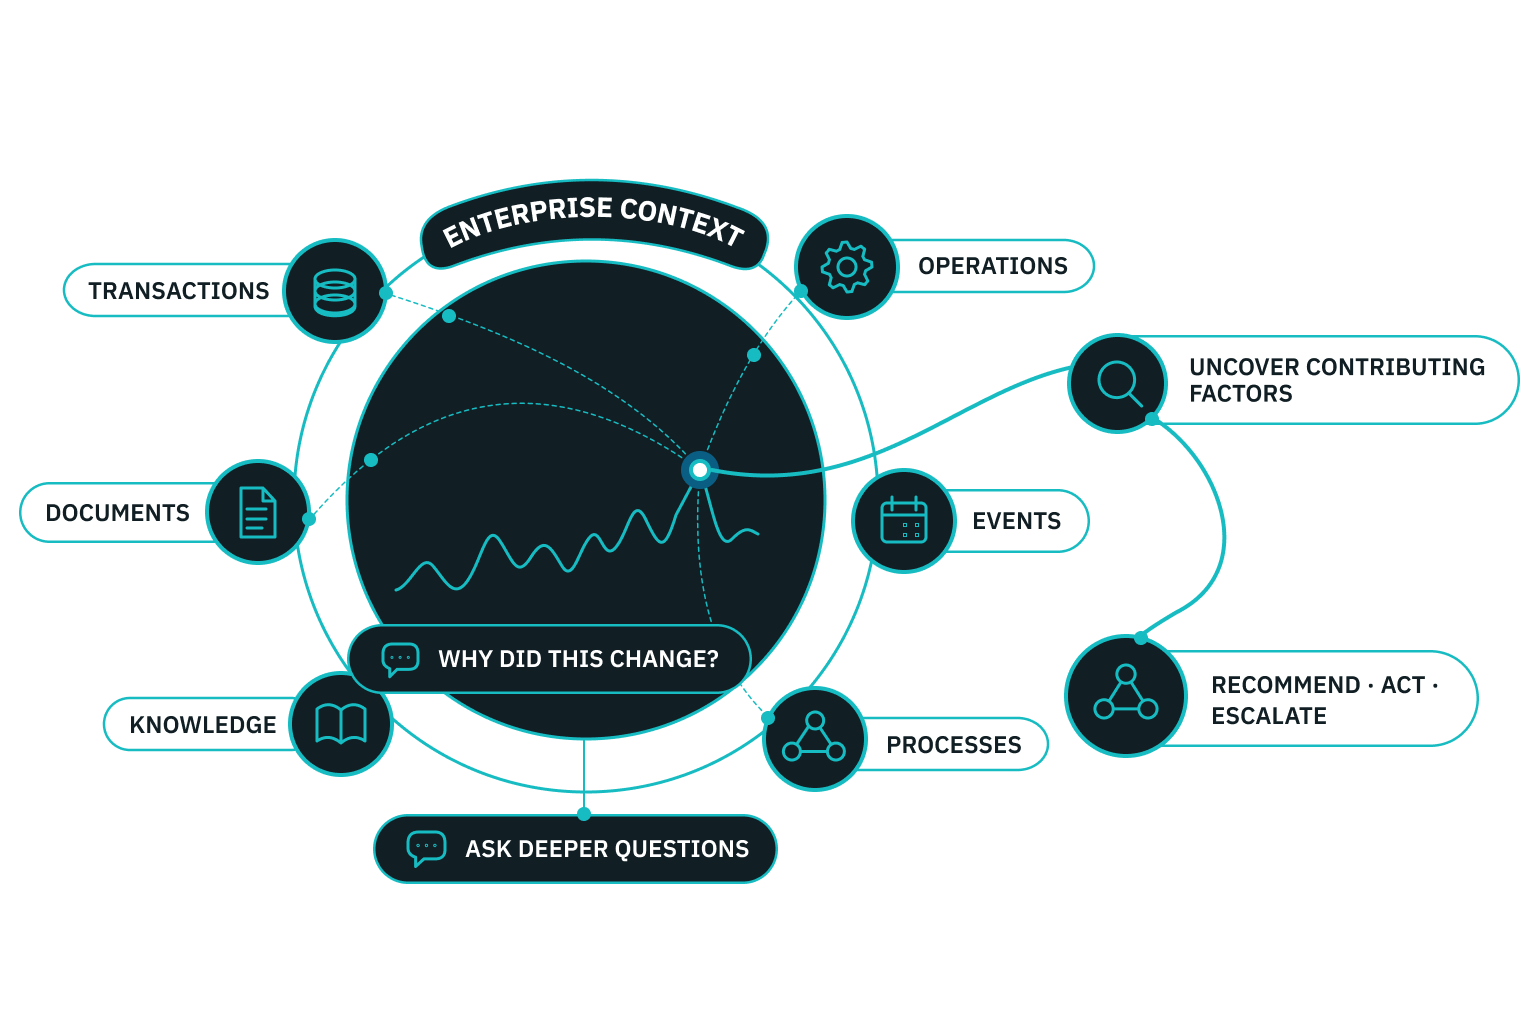
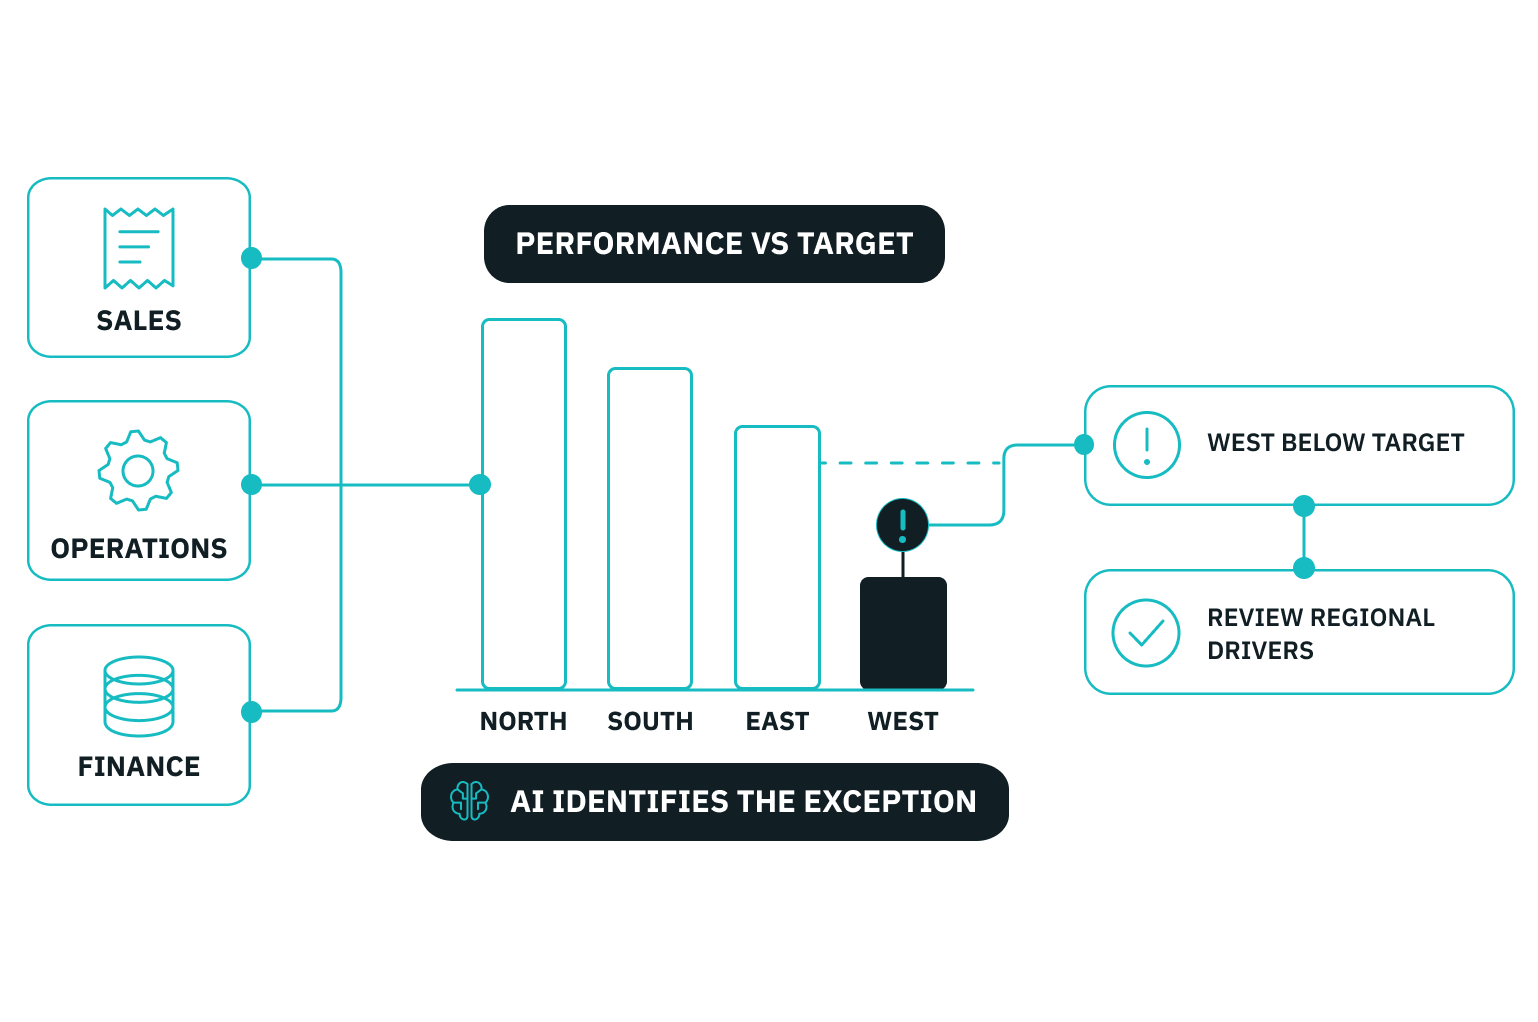
Contextual analytics goes beyond analyzing the data displayed on a dashboard by connecting each metric to the wider enterprise data, knowledge, relationships, and business context needed to understand what happened, why it happened, and what to do next.
- Look Beyond the Dashboard: Analyze underlying and related enterprise data, not only the records currently displayed in a chart or report.
- Understand the “Why”: Connect KPIs and trends with related transactions, operational data, documents, events, and enterprise knowledge.
- Ask Follow-Up Questions: Investigate any metric or anomaly conversationally without building a new report for every question.
- Connect the Dots: Analyze relationships across different data sources, departments, systems, and business processes to uncover contributing factors.
- Move from Insight to Action: Use the broader context to generate recommendations, investigate exceptions, trigger workflows, or escalate issues directly from the analysis.
How Do Dashboard AI & Studio AI Work Together?
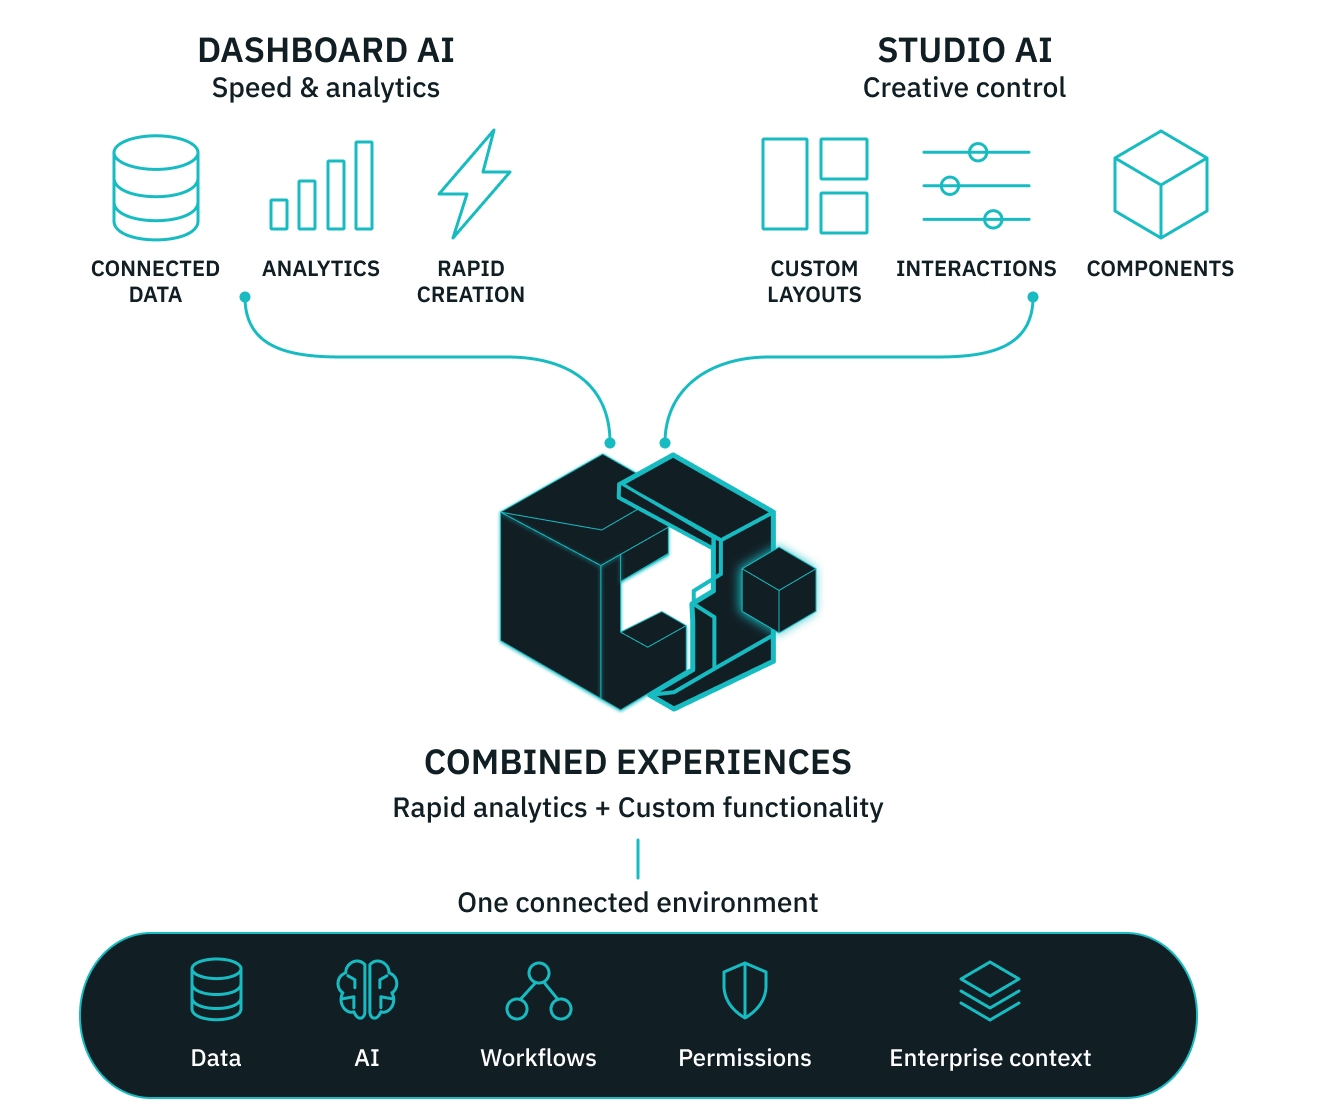
Both can create powerful dashboards, but they take different approaches. Dashboard AI accelerates BI and analytics through data-driven, workflow-based dashboard creation, while Studio AI provides the creative freedom to design highly customized experiences that can be brought directly into your dashboard environment.
- Dashboard AI for Speed: Quickly turn connected data into KPIs, charts, analytics, filters, drill-downs, and AI-powered dashboards with minimal configuration.
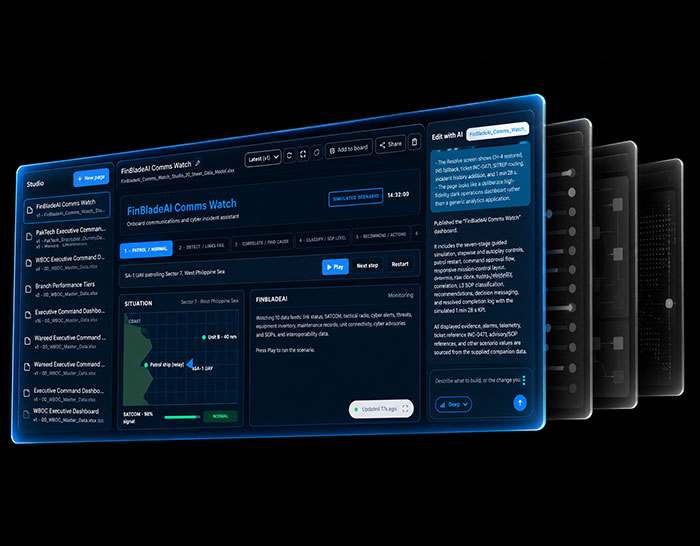
- Studio AI for Creative Control: Design highly customized layouts, visual experiences, interactions, controls, and application-style dashboard interfaces.
- Build the Way You Need: Use Dashboard AI for rapid analytical experiences or Studio AI when greater design flexibility and customization are required.
- Bring Studio into Dashboards: Components and experiences created in Studio AI can be incorporated into dashboard panels, extending standard BI with custom functionality and design.
- One Connected Environment: Both work with the same FinBlade data, AI, workflows, permissions, and enterprise context, allowing you to combine rapid BI with custom-built experiences.
Dashboard and Business Intelligence (BI) Solutions
How They Differ and When to Use Each
FinBlade AI Dashboards
Intelligence to Action
AI-powered dashboards that combine live enterprise data, contextual analysis, workflows, and governed execution in one environment.
-
Data.Live Data + Enterprise Knowledge
-
Analytics.Rules + Statistical + AI
-
Context.Enterprise-Wide & Connected
-
AI.Contextual & Agentic
-
Action.Workflows + Alerts + Execution
-
Governance.RBAC + Governed AI Execution
-
DeploymentOn-Prem / Hybrid / Cloud
-
Speed.Minutes-to-Hours
Standard BI Dashboards
Traditional Business Intelligence
Dashboard-first analytics designed primarily to visualize, explore, and report on structured enterprise data. Usually features time-consuming development.
-
Data.Primarily Structured Data
-
Analytics.Rules + Statistical
-
Context.Dashboard / Data Model
-
AI.Add on / Non-contextual
-
Action.Usually Separate Integration
-
Governance.Report + Data Access
-
DeploymentVaries by Platform
-
Speed.Days to Weeks
Cloud-based
AI Analytics
AI-First Analytics
Cloud-native analytics combining visualization with AI-assisted querying, analysis, and insight generation. Usually does not support workflows.
-
Data.Connected Cloud Data
-
Analytics.Primarily AI
-
Context.Connected Data Environment
-
AI.AI-Native
-
Action.Platform / Integration Dependent
-
Governance.Provider / Configuration Dependent
-
DeploymentCloud
-
Speed.Minutes-to-Hours
Dashboards Built for Enterprise
Connected to Your Data
Contextual AI Analytics
Secure & Governed
Your Data Stays Yours
One Integrated Platform
Intelligence to Action
Enterprise Intelligence That Moves Work Forward.
A complete, governed AI platform to search, analyze, create, automate and execute across your enterprise. Delivering immediate productivity gains and creating long-term institutional value.
AGENTIC COMMAND CENTER
AI-Supported Enterprise Operating Model
WORKFLOW AI
Connect, Automate, Orchestrate, Execute
STUDIO AI
Create, Connect, Visualize, Operate
AI Agents
Define, Reason, Orchestrate, Execute
DASHBOARDS & BI
Analyze, Visualize, Monitor, Act
DOCUMENT DIGITALIZATION
Extract, Structure, Validate, Activate
VIDEO AI / CCTV
Monitor, Escalate and React in Real-Time
ROUTE OPTIMIZATION
Faster, More Efficient and No Delays
MOBILE APP
Enterprise AI. Wherever Work Happens
Agentic Chat AI
Understand, Analyze, Create, Execute